
2023 Stats Review Series: WR
I was talking with a friend recently who doesn’t play fantasy about my Substack, and he asked how much the team a player plays for matters. Honestly it’s a really good question, and ironically one that I discussed in the last post on running backs. Running backs are in a category of their own in a way. The fact is, running back production depends almost entirely on the team a player plays for. It’s why when the starter goes down, the backup often puts up similar numbers, like Zack Moss or Zamir White last year. It’s just that RB scoring isn’t correlated to team scoring in a clean, linear fashion. There is some weight in touchdown upside for guys on higher scoring teams, but you get my point. I hope. I mentioned in the last post how we were likely to see a lot of RBs change teams this offseason. Well the free agency window opened this past week and we saw close to a dozen big names change teams. Enough on RBs, I’ll dive into the impact of all that in a later post, this post is focused on the WRs.
You hear it every year, the NFL is a passing league. As a result, a wide receiver’s production also depends on the team he plays for, or at least the QB throwing him the ball. Gone are the days when you’d see workhorse running backs consistently tally 30 carries per game. The league has shifted to an era where the run is used to setup play-action. That requires us to pay particular attention to the wide receivers on our fantasy teams.
Wide Receiver Stats
WR ADP vs Finish
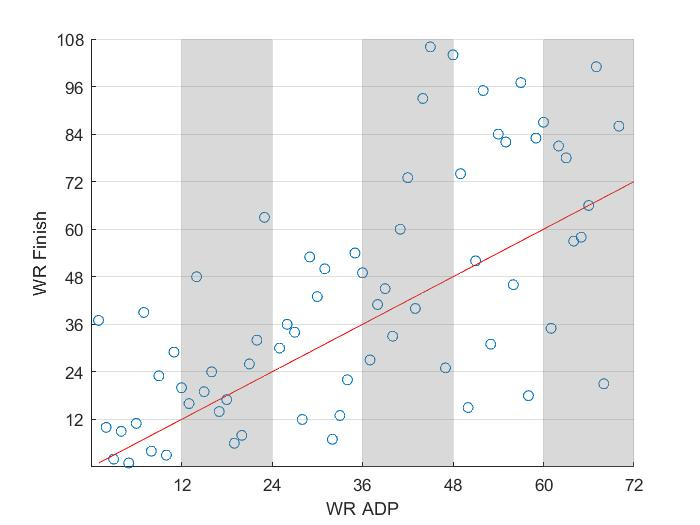
x - WR by average draft position
y - Finish rank
In most leagues, you start the same number of receivers as you do running backs, with one or two flex spots where you can start either (or a tight end). For that reason, I like to compare WRs and RBs because it can give some answer to the question of which position to target for the flex spot and which position to attack first in the draft. Unless something dramatically changes over the next few years, in a single QB league, you cannot convince me to draft anything other than WR or RB in the first two rounds. There may have been an argument for an elite TE in years past, but there’s so much more depth there than there used to be thanks to the breakouts of guys like Sam LaPorta and Trey McBride. Enough ranting, though, let’s get into it.
If you recall the same chart for RBs, in the first round you can already see a trend - the WR1s are quite predictable. All 12 finished WR39 or better, but taking into account the injuries to Justin Jefferson and Cooper Kupp, they all finished 29th or better. For what it’s worth, the two guys I just mentioned, Jefferson and Kupp, finished WR5 and WR25 in points per game. Long story short, if you took a WR with your first pick, you likely weren’t disappointed. For comparison, 7 of the first 12 WRs drafted finished as a top-12 WR, versus only 5 of the first 12 RBs. This pattern continues into the top-24, top-36, and so on.
To take a step aside from the data for a moment, I think this points to a trend we are starting to see in today’s NFL. A lot of teams, especially the high-scoring teams like Miami and San Francisco, are using a quick run-pass option (RPO) scheme where they like to motion the primary receiver to create an advantage and target him on the first read. We used to see teams with a 1A/1B receiver combination, think Tyreek Hill and Jaylen Waddle, or AJ Brown and DeVonta Smith, but there seems to be a gap emerging. For that reason, rostering one of these alpha receivers is almost a necessity if you want any chance at winning your league.
Target Share, Yards Per Route Run vs Fantasy Points Per Game
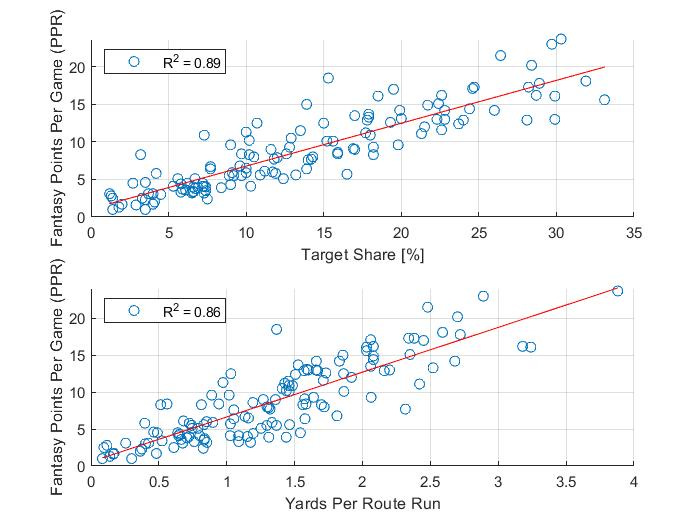
x - Target share (top), yards per route run (bottom)
y - Fantasy Points Per Game (PPR)
If you aren’t familiar with these stats, target share is the percentage of a team’s pass attempts that are thrown to a particular player, and yards per route run (YPRR) is just as it sounds, the number of receiving yards divided by the number of routes a player runs. If I put up a plot similar to the one above of targets vs fantasy points, you’d see a similar correlation. Targets are more a reflective stat rather than a predictive one, whereas a player can have a strong YPRR on limited routes giving us some evidence of his potential to breakout. I’ll give a few examples from this past season to show what I mean.
It makes me laugh thinking back to this, but I can remember debating between adding Kendrick Bourne or Puka Nacua after week one. Bourne actually scored more points that week, and someone chasing points might be attracted to his 2 touchdowns thinking he gets more red-zone targets. Taking a look under the hood, though, here’s where Puka stands out:
Kendrick Bourne - 20.4% target share, 1.36 yards per route run
Puka Nacua - 39.5% target share, 3.40 yards per route run
It’s just a one game sample size and I remember people being nervous about Puka’s production once Cooper Kupp returned from injury, but those numbers are just absurd, especially for a rookie. Look at where they fall on the chart. While he would never be able to sustain those numbers, he finished with a 28.9% target share and 2.93 YPRR on the season, 7th and 6th respectively among all receivers.
Jayden Reed is another great example. He was likely not drafted in your league, but after posting 19.7 PPR points in week 2 he caught a lot of attention. In those first two games, he posted a 25% target share and 2.24 YPRR. Referring back to the chart again, that puts him on pace for just shy of 15 points per game, and that was while playing only on 3 receiver sets. If he got on the field more, he would’ve had massive breakout potential. Reed ended up finishing with 13.5 PPG, good enough for the overall WR19 finish. This is what I mean by these stats being predictive. Both of these guys were likely available on waivers, and when the stats back up the output, you can feel confident picking them up with the hopes of finding a diamond in the rough.
QB Yards Per Attempt vs Primary WR/TE Yards Per Route Run
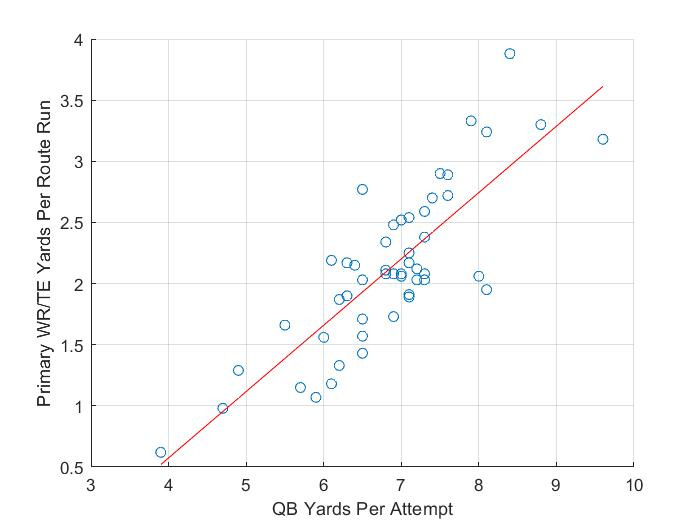
x - QB yards per attempt (min. 75 attempts)
y - Highest YPRR on team among WR/TE
Now that we’ve discussed the importance of target share and YPRR, let’s do a little reverse engineering to see where they come from. In most cases, when a quarterback drops back to pass, there are five eligible pass catchers. For that reason 20% is a pretty good threshold for target share. A player earning a target more than once per five pass attempts is out earning his peers. If you take all the pass catchers on a team and add together their yards per route run you’d get something close to the QBs yards per attempt. So it’s no surprise there’s correlation here. When a QB has a higher yards per attempt, his receivers have a higher YPRR. Everything I’ve said up to this point may be pretty obvious so let me explain. Amari Cooper is one of my favorite examples. He actually shows up on this chart four times. After Deshaun Watson’s injury, the Browns shuffled through P.J. Walker and Dorian Thompson-Robinson before bringing in Joe Flacco. Let’s look at Amari Cooper’s numbers with each QB:
Dorian Thompson-Robinson YPA: 3.9 | 16.5% target share, 0.62 YPRR
P.J. Walker YPA: 6.1 | 28.0% target share, 2.19 YPRR
Deshaun Watson YPA: 6.5 | 23.3% target share, 2.77 YPRR
Joe Flacco YPA: 7.9 | 24.1% target share, 3.33 YPRR
The difference between Flacco and DTR is enough to make an elite WR become fantasy irrelevant. To take this a step further, target share is a good metric to identify talented WRs who are stuck with bad QB play. Aside from DTR, Cooper commanded a similar target share from the other three QBs, yet you can see how his YPRR numbers vary with the QB efficiency.
Using this same approach, here are a few other players that had 20%+ target share marks, but could still improve in terms of YPRR and QB YPA:
Garrett Wilson: 29.9% target share, 1.56 YPRR, 5.27 QB YPA
George Pickens: 22.8% target share, 2.20 YPRR, 6.15 QB YPA
Davante Adams: 33.1% target share, 2.03 YPRR, 6.75 QB YPA
Terry McLaurin: 21.5% target share, 1.57 YPRR, 6.5 QB YPA
Drake London: 21.3% target share, 1.91 YPRR, 7.1 QB YPA
At the time of writing, the NFL free agency period just began, and we’ve already seen some of these guys get new QBs. I’ll send out a post discussing moves from free agency and the draft, but for now these are a few players I’ll be paying attention to.
Picking up where the intro left off, I’m not sure what these posts will look like by the time the season rolls around. I’ve thought about how the majority of content you’ll find is player specific, and I don’t want to add to the noise, so I may discuss team level trends. There’s still a lot of time to decide of course. Let me know if there’s something you think would be valuable or are interested in. Anyway, here are my favorite takeaways at WR:
Try to get a core of good receivers early in the draft that you can plug into your starting lineup and week in, week out.
It might sound crazy, but I’m not opposed to taking a WR with the first four picks. I’m certainly not leaving round 5 without at least 3.
Target share and yards per route run provide a good litmus test. Here are some quick tiers: WR3 ~ 20% target share, 1.8 YPRR. WR2 ~ 24% target share, 2.2 YPRR. WR1 ~ 26% target share, 2.6 YPRR.
Look for players who are tied to good QBs. YPRR has a strong correlation to QB efficiency (YPA).