


2023 Stats Review Series: RB

I’m really excited to get into the running back position in this piece. If you’re just picking up this series here, I covered quarterback first. You can find that here. Quarterbacks are so hard to predict, which I know sounds like a lazy excuse for someone analyzing data, but it’s true. Just last year, people like to compare Bryce Young and CJ Stroud because they were taken back-to-back in the draft. The first overall pick, Young, kinda flopped. And CJ Stroud had a stellar rookie season. But that doesn’t even begin to scratch the surface. There is so much nuance and variance in this game we play, and in the sport in general. It’s not like you could just swap these two players, put Stroud in Carolina and Young in Houston and expect that Carolina would be the team to go on and win a playoff game. It’s just not that simple. Just going back the last few draft classes, Brock Purdy was taken in the 7th round of the 2022 draft and looks like a stud. Zach Wilson was taken second overall in 2021 and could barely lead an offense when given the opportunity. Going back to 2017, Patrick Mahomes was taken behind Mitchell Trubisky. You get my point, there are NFL scouts and GMs who do this for a living and still struggle to get it right. Thankfully for us, quarterback is not the most important position for our fantasy teams like it is for NFL teams. Ok, I’ve done enough ranting. I’m excited to get into the running back position.
Running Back Stats
RB ADP vs Finish
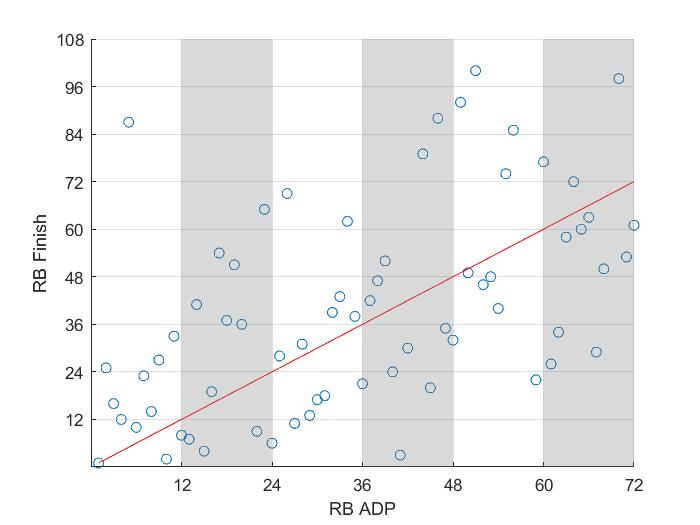
x - RB by average draft position
y - Finish rank
This is essentially the same concept as the QB bar chart of ADP vs Finish. Instead, here the red line represents what would happen if every RB finished in the same order he was drafted. We’re especially interested in players who finished below the red line (further below = better), meaning they outproduced their draft position. To keep things simple, I’ll refer to the red line as the expected finish. Just like QB, this makes the top-12 RBs (RB1s) look bad, but unless they all finish in the order they were drafted, one player performing better than expected means another player in this range has to perform worse. To put it simply, the further you move to the right, the more opportunity there is to finish better than expected. To help the case for RB1s, all but Nick Chubb (injury) finished as the RB33 or better. For RB2s, that grows to RB65. So while the higher drafted guys may not consistently finish ahead of expectation, they are safer. Taking a step back, here’s a quick breakdown that might make this easier to digest:
RB1 (1-12) - 3/12 finished better than expected, 5/12 finished in the top 12
RB2 (13-24) - 4/12 finished better than expected, 5/12 finished in the top 24
RB3 (25-36) - 5/12 finished better than expected, 7/12 finished in the top 36
RB4 (37-48) - 6/12 finished better than expected, 8/12 finished in the top 48
There’s a clear pattern here - the later in the draft you select a particular RB, the more likely he is to finish better than expected and the more likely he is to finish in the range he was drafted. Unless you play in a really deep league, getting into RB4 and beyond are the guys that you’ll typically find on waivers. Looking at the graph, though, there are still plenty of guys RB50+ ADP who finished top-36 or even top-24, so it’s worth taking a shot at a few of them. That’s why it’s crucial to get depth at the RB & WR positions where you are required to start multiple players. Without looking at names, my goal for this sort of analysis is to find if there’s a clear region of the draft where to select a particular position. An overly simplistic way to frame it is asking is it worth spending a round 1 or 2 pick on a 42% chance of getting an RB1 versus waiting and spending a round 3-5 pick on a 25% chance of getting an RB1? Then, what are the probabilities if you pick another position instead? I’ll get to WR in the next post, but overall there is less volatility at the top end compared to RBs indicating there is less risk in prioritizing the WR position early.
Points Per Rush vs Points Per Target
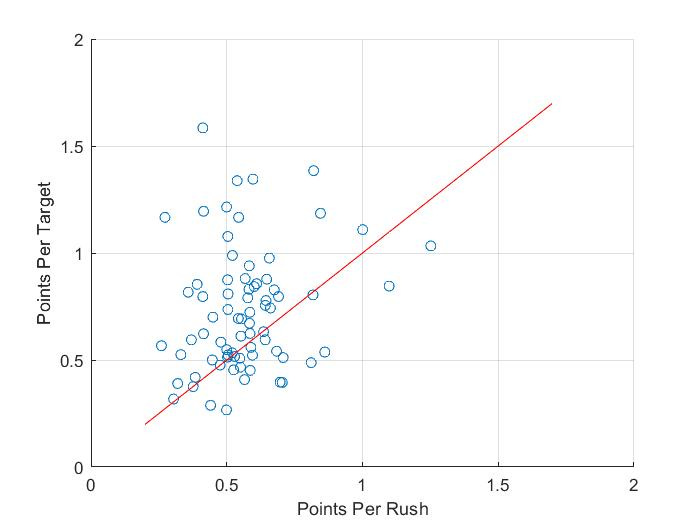
x - Fantasy points per rushing attempt (min. 30 attempts)
y - Fantasy points per target (min. 5 targets)
One of the biggest arguments against the PPR scoring format is that receptions aren’t inherently valuable in an actual NFL game. For example, a catch for -5 yards is worth more than a rush for 4 yards in fantasy but obviously not for the actual game on the field. Without getting into the pros and cons, there’s no doubt it changes the landscape for the running back position. Everything else I’ve discussed has assumed PPR scoring, however, the graph here shows non-PPR (standard) scoring, otherwise we’d be comparing apples and oranges. What this means for fantasy managers is that we want to target backs with a role in the passing game. Much like the position vs ADP charts, the red line represents an RB who scores the same number of points for each target as he does each rushing attempt. I want to highlight here, it is targets not receptions because targets give a better representation of a players ability to get involved in the offense. Hence, my favorite phrase, targets are earned. Unfortunately for us, a large part of the fantasy production at the RB position comes from touchdowns, and the current trend in the NFL is to use one “between the tackles” type back at the goal-line, and a different “pass-catching” back on passing downs. So the pass-catching backs we are interested in don’t often have as much touchdown upside.
With that being said, let’s look at what the data is telling us. Like I mentioned before, all the data cluttered around the red line would indicate a rushing attempt and target are equal. Yet, at first glance, we see much more data above the line, meaning targets are more valuable. Some targets become dropped passes, yet they are still more valuable! Averaging all RB’s points from rushing vs points from receiving shows a target is 1.37x more valuable for standard scoring, meaning points only come from yards and touchdowns. For PPR, this number climbs to a massive 2.87x. For context, Breece Hall had 93 targets compared to 186 rushing attempts, exactly 50%. He turned those 93 targets into 155.9 points compared 105.6 points from rushing despite having half the opportunities.
Top Scoring Teams vs RB1/RB2 Fantasy Points

x - Top teams by total offensive points scored from left to right
y - Fantasy points from RB (RB1 - blue, RB2 - orange)
This is a theory I’ve put into practice on many occasions that I wanted to test. A narrative I’ve often heard is to target players that are a part of high scoring offenses. On the surface it makes sense, the more a team scores, the more fantasy points there are to be distributed among the players of that team. First off, yes, 3 of the top 4 teams had monster production from their RBs. But I doubt I could guess who the top 4 offenses are going to be next year, and even if I did, that doesn’t mean their RBs are going to have good seasons. Who knows, it could be the Ravens again.
During the draft this past season I picked Cam Akers instead of Rachaad White because I was expecting the Rams to have a better offense, which meant Cam Akers would have more opportunity. My process was right, the Rams did have a better offense, but Rachaad White was the one with a top-10 finish despite playing for a middle of the pack offense. The fact is, and the data backs this up, it’s not as simple as picking pieces of the top offenses. There are so many factors at play here. For example, the Ravens had the number 3 offense, but Lamar Jackson is always going to get his share on top of the 3-way backfield they sent out in Gus Edwards, Justice Hill and Keaton Mitchell. Further down the list, the Falcons, Steelers and Titans were among only 6 teams to amass 350+ points from their primary running backs despite lacking any sort of firepower on offense.
I still don’t think investing in high scoring offenses is a bad idea - it can be a useful factor to decide between two players with similar numbers in what might otherwise be a coinflip. The lesson here is to put more weight into the underlying volume numbers: how many carries/targets does a player get, how many goal-line/red-zone opportunities, how many tackles do they break? Those are the reasons why a player like Derrick Henry finished as the RB5 overall while playing for the 27th ranked offense.
Trivial Rush Attempt Percentage
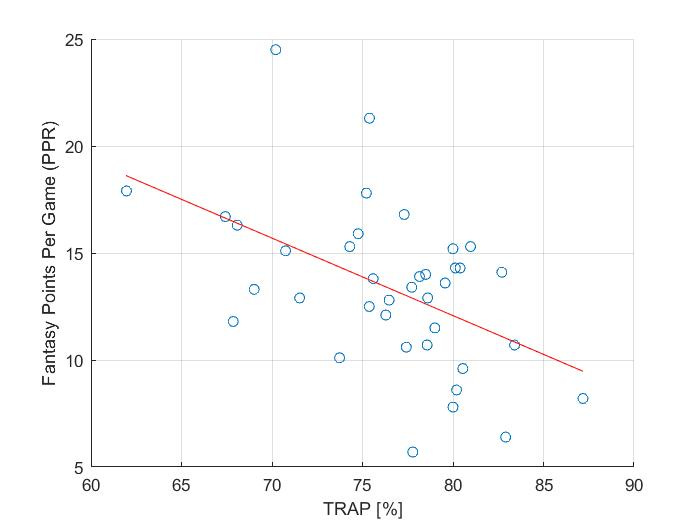
x - Trivial Rush Attempt Percentage (min. 150 opportunities)
y - Fantasy Points Per Game (PPR)
I just discovered this stat from Ben Gretch and it’s quickly become my new favorite. I was confused by the name, trivial rush attempt percentage, the first time I saw it. Here’s some background as to how he arrived at this stat and what it means. Among the top 50 backs in 2023, 22% of their fantasy points came from touchdowns alone. It makes sense that the probability of scoring a touchdown increases exponentially as a player gets closer to the goal line, with a large majority of touchdowns for RBs coming within the 10-yard line, or the green-zone. As I discussed earlier, the other large category for RB production comes from receiving work. For the same top 50 backs, 40% of their fantasy points came from receptions.
So if we separate RB opportunities into three categories: receptions, green-zone rushing attempts, and non-green-zone rushing attempts, we want to target players whose volume comes from the first two categories. So the stat, trivial rush attempt percentage, is the percentage of opportunities that are neither receptions or green-zone rushing attempts. As you can guess, we want this number to be low. I like this stat so much because volume is still obviously correlated to RB production, but giving volume some context and defining what eventually is an efficiency stat highlights which subset of players have the most upside. Here’s an example to show what I mean:
Jahmyr Gibbs - 221 total opportunities, 67.4% TRAP
Devin Singletary - 221 total opportunities, 80.5% TRAP
Both Jahmyr Gibbs and Devin Singletary finished with the exact same number of opportunities so if you subscribe to the volume is king narrative you’d expect they scored a similar number of fantasy points. Looking at TRAP, though, tells us Gibbs’ opportunities were much more valuable. When the books were closed on the fantasy season, Gibbs scored 233.1 fantasy points, while Singletary scored just 153.8 on the same amount of work.
While maybe not as difficult as QBs, the ADP vs finish chart showed us that RBs are still difficult to predict. The buzz around the league right now is that the incoming draft class isn’t that strong. Or at least there aren’t any can’t miss prospects like we had in 2023 with Bijan Robinson and Jahmyr Gibbs. On top of that, we’re just getting into the free agency season and it’s sounding likely that some of the top guys like Saquon Barkley, Derrick Henry and Josh Jacobs could be on new teams. Which all means we should expect some shakeup heading into the 2024 season. Here are my favorite takeaways at running back:
Use a shotgun approach when drafting running back. There isn’t a clear range of the draft like you could argue for quarterback. Just draft a lot of them and hope at least 1 or 2 hit.
Target running backs with a receiving role and work around the goal line (low TRAP, or about 3+ targets and 1.5+ green-zone opportunities per game)
Picking players in high scoring offenses doesn’t matter as much as you’d think