


2023 Stats Review Series: QB
I had everything written up, nearly ready to go and decided it was too long. My goal isn’t to put you to sleep. Instead of covering all four major positions (QB, RB, WR and TE) in one post, this will be the start of a series with a dedicated post focusing on each position.
The couple weeks leading up to the start of the NFL season is one of my favorite times of the year. Besides the weather being beautiful in August here in Michigan, I enjoy putting together a draft strategy and listening to who the experts think are the breakout candidates and sleepers for the upcoming season. Getting a guy in the late rounds who puts up top-10 numbers is probably the most satisfying part of fantasy football short of winning the league. There are several guys who do it every year, and even though it’s mostly luck finding who those guys will be, there are still decent indicators if you know what to look for. It’s way too early to start dropping names - my goal with this series is to highlight a few of the stats based on data from the 2023 season that correlate well to fantasy production.
Quarterback Stats
QB ADP vs Finish
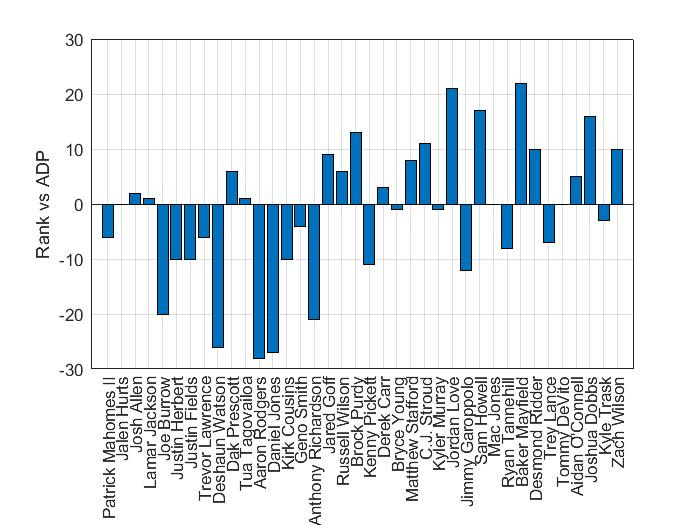
x - QB by average draft position from left to right
y - Finish rank vs ADP (positive means the player finished better than expected)
If you read my first post, this is similar to the exercise I did when analyzing each team. If you didn’t but want to, you can find it below. When comparing where a player finished vs their average draft position, I’m not trying to determine which players did poorly and which players took the league by storm. That wouldn’t do us any good going forward because while Jordan Love finished 21 spots ahead of where he was being drafted, he’s not going to be the 26th QB off the board again next season. What’s more interesting, is looking to find trends that can indicate where to find value at the position. At first glance, this chart would make you never want to draft a top-15 QB, as 10 of the 15 finished below ADP. I think there’s more to it, though. First off, the guys at the top don’t have any room to move up. For example, unless Patrick Mahomes finished as the overall QB1, he would finish below ADP. For the most part, besides Joe Burrow’s disappointing season, the top-5 guys gave you what you paid for. Furthermore, guys like Desmond Ridder and Aidan O’Connell technically finished above ADP, but we’re talking about a QB22 finish vs a QB32 ADP. In a standard 12-team league, having the QB22 isn’t going to get the job done. So what can we take away? There is a clear range here, between Jared Goff (QB17 ADP) and Sam Howell (QB28 ADP) where there is value. There’s a good chance a majority of these players aren’t being drafted at all. Between Jared Goff and Sam Howell, 8 of 12 QBs finished above ADP. The average ADP in this range is QB22.5 and the average finish is QB17.5. Granted, QB17.5 doesn’t pop off the page as league winning potential, but considering the first 12 QBs taken had an average finish of QB14.5, this isn’t bad taking into account the low draft capital invested in late round QBs. Don’t get me wrong, I’m not against taking a QB early, the top 4 all produced and there’s more than one way to win. But this is the focal point of the late round QB draft strategy - you can wait on drafting the QB position and still have a decent chance of getting a top-10 player as we saw with Brock Purdy, Jared Goff and Jordan Love. If they don’t produce, you didn’t spend much in the first place so you can drop them for another player in this range.

QB PPG Sorted vs Team Pass Attempts
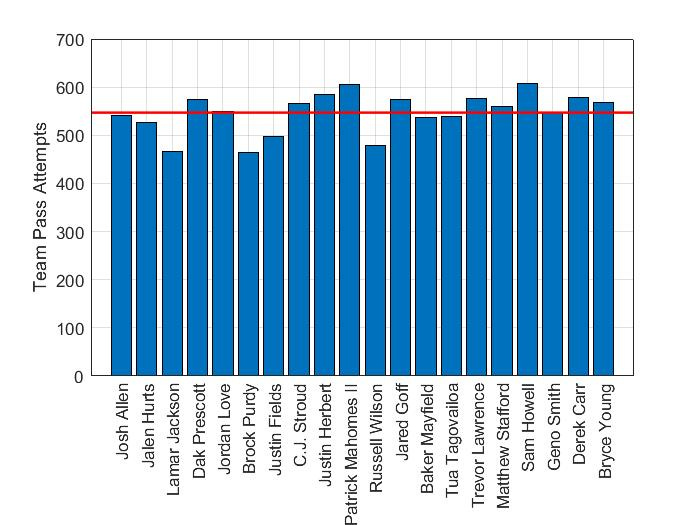
x - Top-20 QBs by fantasy points per game from left to right (min. 12 games)
y - Team pass attempts
Everyone will tell you, the three words fantasy players live by - volume is king. Context is important, so let’s let the data tell the story. I made reference to this in the first post, but I wanted to investigate the data a little further to see how much of an impact volume has at the QB position in particular. The summary is this, the QB position is less influenced by volume (compared to RB/WR/TE) because they aren’t competing with anyone for the volume. In short, the QB gets essentially every pass attempt a team makes. Ironically, the opposite of volume is king seems true for QBs. For reference, the red line on the chart above is the average (547 pass attempts) to highlight whether the team attempts more/less passes relative to their peers. The top-3, and 5 of the top-10, were all below the average in pass attempts. Furthermore, the bottom 6 of the 20 shown were either above average, or right at average in the case of Geno Smith. I get pass attempts aren’t the only volumetric statistic that matters for QB fantasy production because rushing is involved too. I’ll show another chart next to look into the impact of dual-threat QBs. The reason I wanted to look into this was to see if game script played a role in the fantasy output of a team’s QB. Does a QB playing for a team that plays from behind more often, and thus leans toward passing more, score more fantasy points? The data in this case indicates the answer is no.
QB Percentage of Points From Rushing vs Fantasy Points Per Game
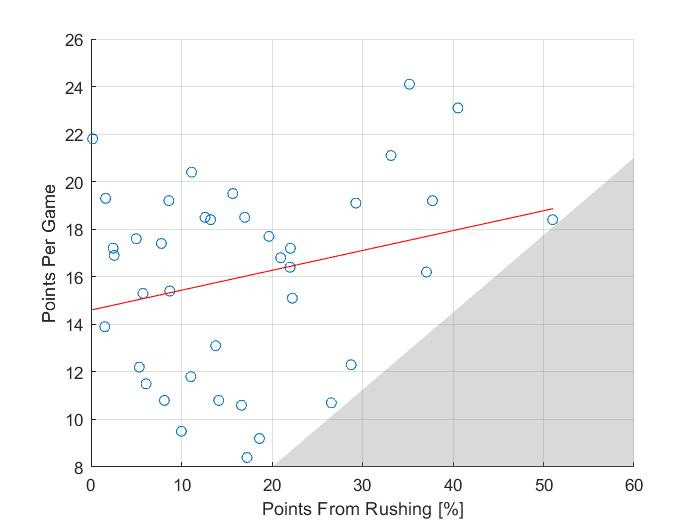
x - QB fantasy points from rushing / total fantasy points (%)
y - Fantasy points per game
I’m not going to argue that this is a perfect stat. But before you look at this graph and say there’s a weak correlation, if any, hear me out. Instead of needing to rely on stats that might predict how a player will perform, something like backfield rush share or a receiver’s target share, you can pretty confidently pick out who are the QBs with a rushing element to their game. Just looking at preseason ADP, it wouldn’t be hard to guess Jalen Hurts, Josh Allen, Lamar Jackson, Justin Fields, Anthony Richardson, Kyler Murray, etc. would all have an impact on the ground. Those seven names I just listed, all averaged 18.4 points per game or better by the way. Hurts, Allen and Jackson all finished at or above ADP which might not sound like a big deal, but looking back to how QBs performed vs ADP, only 4 of the first 10 did so. Had Fields, Richardson and Murray all played full seasons I’m confident they would’ve finished ahead of ADP as well. Which brings up an interesting point, people are often nervous to draft a dual-threat QB because of the injury risk. Here’s a list of QBs that suffered season-ending injuries: Joe Burrow, Justin Herbert, Deshaun Watson, Aaron Rodgers, Daniel Jones, Kirk Cousins and Anthony Richardson. Burrow, Herbert, Rodgers and Cousins are all pocket-passers. More than half the list. Enough arguing my point, let’s get back to the data. I drew a boundary (greyed out area of the graph) to help visualize this idea:
<20% points from rushing - 42% below 14 PPG
20-30% points from rushing - 28% below 14 PPG
30-40% points from rushing - 0% below 16 PPG
>40% points from rushing - 0% below 18 PPG
Simply put, more points on the ground relative to the overall output equals more points, which is what we’re all after. This is usually reflected in ADP, so you’ll have to pay up for the high-end QBs, but you can feel more confident spending high draft capital on an elite dual-threat QB knowing they’ll produce.
Yards Per Attempt vs Points Per Game From Passing
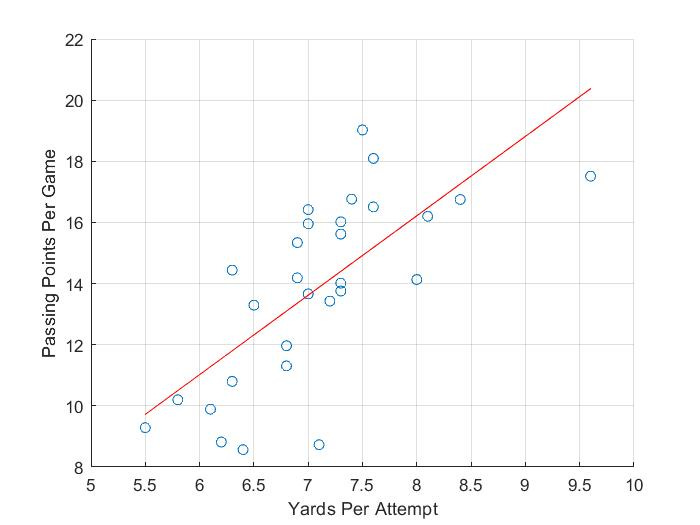
x - Yards per attempt (min. 300 attempts)
y - Fantasy points per game from passing
Efficiency stats usually aren’t useful from a fantasy perspective, at least compared to volumetric stats. That’s where the volume is king argument comes from. Yards per carry for a running back, for example, doesn’t get close to total opportunities. There’s still merit in looking at efficiency stats, though. We saw when it comes to QBs, volume isn’t important. Looking at yards per attempt in addition to the rushing element we just looked at begins to paint a picture. Again, the correlation isn’t perfect because there are so many inputs that determine a QB’s output, but understanding the underlying factors can help us determine what type of player does well from a fantasy perspective. Here’s my point, you can put up a graph of touchdowns scored vs fantasy points and there would probably be a decent correlation, but good luck predicting how many touchdowns a QB is going to score. Yards per attempt, on the other hand, is more a factor of the offense a QB operates in which tends to remain relatively constant over the course of a season. Think of a team like the Dolphins - their offense is built around tons of motion, run-pass-options (RPO) and throwing the ball deep to Tyreek Hill and Jaylen Waddle. That’s all based on McDaniel’s play calling and getting the ball in the hands of their playmakers. That’s not likely to change barring some major injuries. Going back to the data, there seems to be clear distinction around 7.0 yards/attempt.
< 7.0 yards/attempt - 11.5 average points per game from passing
≥ 7.0 yards/attempt - 15.45 average points per game from passing
So, as fantasy managers, we like QBs efficiently move the ball down field. The picture becomes more clear when we put this together with the previous point about QBs with rushing upside. For example, Justin Fields and Josh Dobbs were both part of the class of >30% points from rushing, and while they had a respectable 19.2 and 16.2 points per game, they were below the 7.0 yds/att threshold. Here are a few players that fit into both categories: Josh Allen, Jalen Hurts and Lamar Jackson. AKA the QB1, QB2 and QB3 in fantasy. I wouldn’t usually recommend drafting a rookie QB, but if you’ve watched any college football, you may have heard of another guy named Jayden Daniels who fits this mold. I’m not opposed to drafting him in the later rounds depending on where his ADP ends up if you are looking for value.
I realize at the time of writing it’s February, this isn’t relevant for another 6 months. I’ll cover a lot more in that time to help narrow things down. I hope this series can help build a foundation, though, to know what to look for at each position. I’ve certainly learned a ton after digging through all the data and putting this piece together. If you want, you can refer back to this. These are my favorite takeaways at quarterback:
Avoid QBs 5-10 range in the draft, either pay up for an elite guy or play the late round QB game
Passing volume is not important
Look for dual-threat QBs and efficient QBs (20+ rush yards per game, 7+ yds/att)
I’ll be sharing a similar review soon covering running backs before moving on to wide receivers and finally tight ends. I’m excited for the next few months once we get a clearer picture, then we can revisit these stats through the lens of building a strategy.